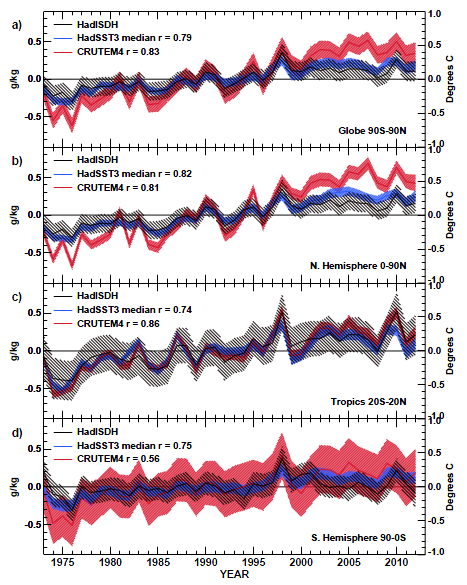
Fig. 13. Comparison of large-scale annual average time series from HadISDH land specific humidity with land surface air temperature from CRUTEM4 (Jones et al., 2012) and sea surface temperature from HadSST3 (Kennedy et al., 2011a, b), including uncertainty ranges. Temperature data have been adjusted to have a zero mean over the 1976–2005 climatology period of HadISDH. Correlations between the land air temperature and SST and land surface humidity have been performed on the detrended time series.
HadISDH: an updateable land surface specific humidity product for climate monitoring HadISDH is a near-global land surface specific humidity monitoring product providing monthly means from 1973 onwards over large-scale grids. Presentedherein to 2012, annual updates are anticipated. HadISDH is an update to the land component of HadCRUH, utilising the global high-resolution land surface station product HadISD as a basis. HadISD, in turn, uses an updated versionof NOAA's Integrated Surface Database. Intensive automated quality control has been undertaken at the individual observation level, as part of HadISD processing. The data have been subsequently run through the pairwise homogenisation algorithm developed for NCDC's US Historical Climatology Network monthly temperature product. For the first time, uncertainty estimates are provided at the grid-box spatial scale and monthly timescale.
HadISDH: an updateable land surface specific humidity product for climate monitoringK. M. Willett, C. N. Williams Jr., R. J. H. Dunn, P. W. Thorne, S. Bell, M. de Podesta, P. D. Jones, and D. E. Parker
Clim. Past, 9, 657-677, 2013
www.clim-past.net/9/657/2013/
doi:10.5194/cp-9-657-2013
© Author(s) 2013. This work is distributed
under the Creative Commons Attribution 3.0 License.

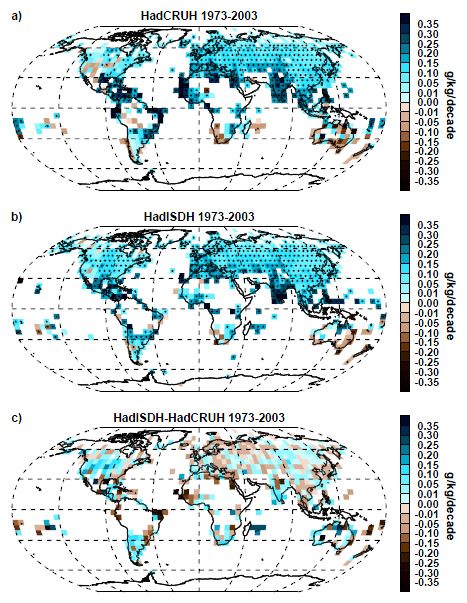
Fig. 9. Decadal trends in specific humidity for HadCRUH versus HadISDH over the 1973–2003 period of record. Trends have been estimated using the median of pairwise slopes (Sen, 1968; Lanzante, 1996) method. Where intervals defined by the 95% confidence limits on the median of the slopes are both of the same sign as the median trend presented in the grid boxes, the trend is presumed to be significantly different from a zero trend. This is indicated by a black dot within the grid box. This means that there is higher confidence in the direction of the trend, but not necessarily the magnitude. The spread of the confidence interval provides the confidence in the magnitude; these values are available online at www.metoffice.gov.uk/hadobs/hadisdh. Note non-linear colour bars.

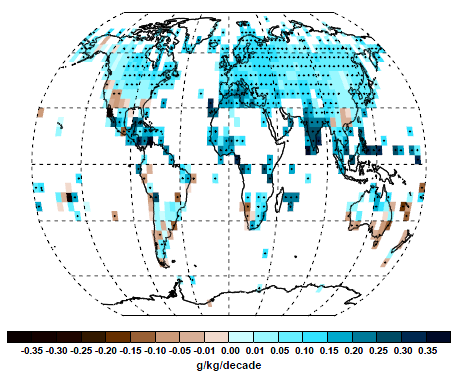
Fig. 11. Decadal trends in specific humidity for HadISDH over 1973–2012. Trends are fitted and confidence assigned as described in Fig. 9. Note non-linear colour bars.


